“What’s the latest revenue number?” When reviewing performance, most marketers jump straight to this question.
Is revenue relevant? Of course. But looking at conversion rate and not much else is what we call The Flat Approach to KPIs (Key Performance Indicators) because it’s missing a lot.
We’d like to (in the friendliest way ever) challenge some of the ways you’ve been taught to think about and use KPIs. Let’s dig into:
- The difference between primary, secondary and tertiary KPIs
- 11 steps to KPI setting
- What KPIs to measure at each stage of the funnel
- A client-partner KPI example
- And more!
What are KPIs?
A crucial aspect of the data-centric approach to marketing is the meticulous selection and monitoring of the right performance measures (aka: KPIs).
Some KPI metrics are universal to all brands, but every brand should be tracking its own specific KPIs to accurately assess the effectiveness of their marketing efforts.
KPIs provide quantifiable data that benchmarks your current performance. But maybe more importantly, tracking the right KPIs means that data collection will produce the highly specific optimizations roadmap your brand needs most.
Don’t wait until the quarterly report or end of a campaign to look at your KPIs. Quick pivots that support performance are only possible when an expert is monitoring KPI performance weekly – in many cases, daily.
Primary KPI vs Secondary KPI vs Tertiary KPI
High performing marketing teams rely on three types of KPIs:
- Primary
- Secondary
- Tertiary
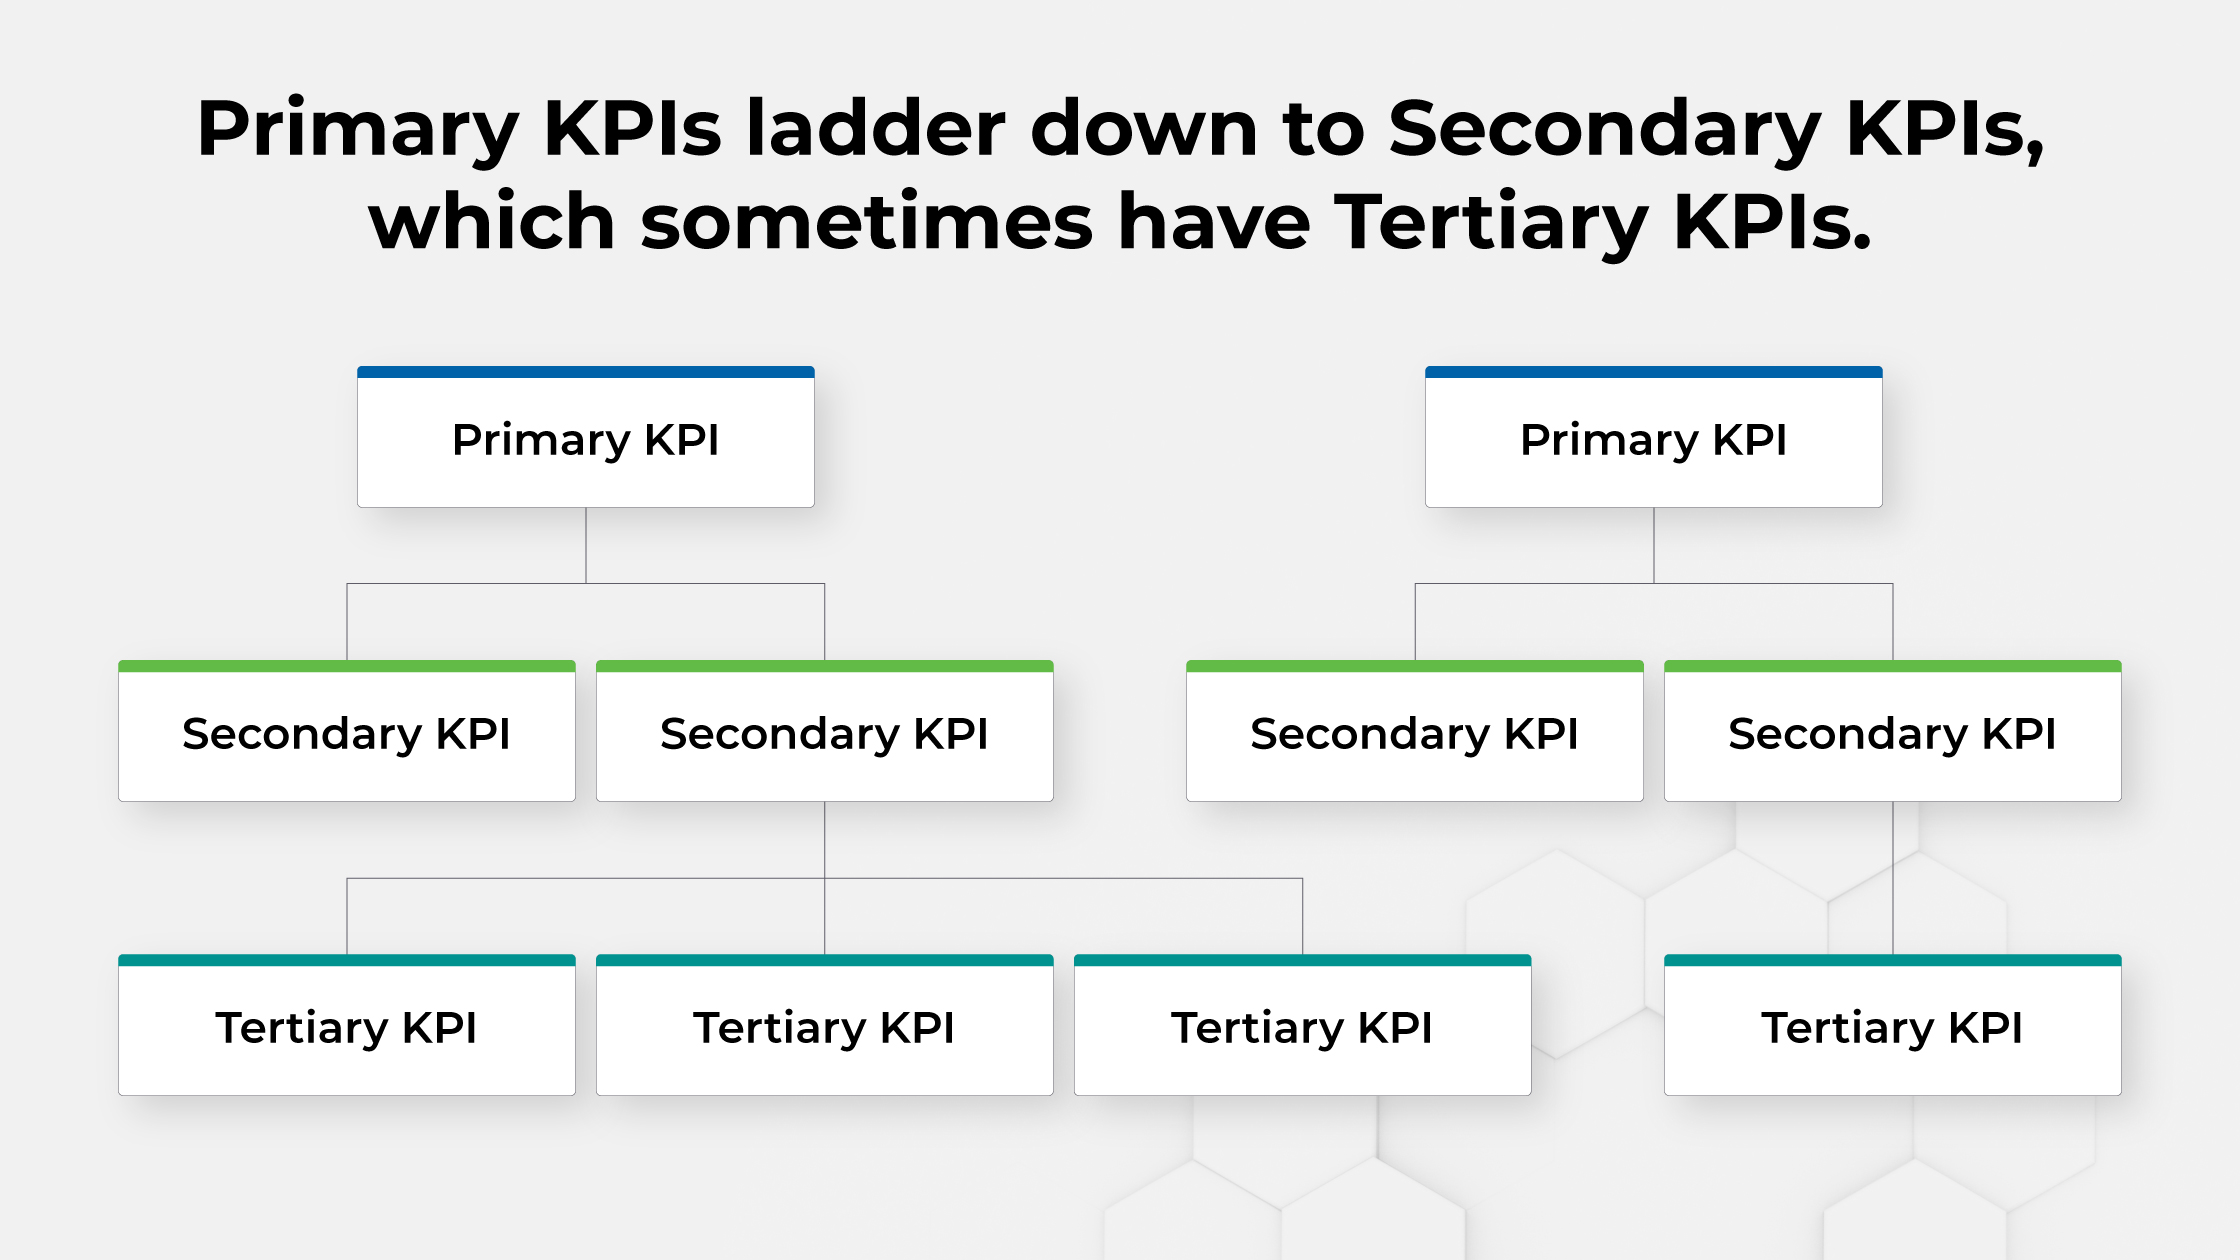
Primary KPIs are the top-line metrics that most directly reflect your key business objectives. They answer the “Did we succeed or fail?” question.
Some of the most common primary KPIs are:
- Total revenue
- Profit margin
- Customer lifetime value
- Return on investment (ROI).
Secondary KPIs are important because they provide a deeper layer of insight into the success of your primary KPIs.
These metrics are focused on understanding the effectiveness of your marketing strategies or campaigns. Secondary KPIs could include metrics like:
- Conversion rates
- Website traffic
- Engagement on social media
- Lead generation
- Customer acquisition cost.
Tertiary KPIs are the most granular metrics you track. They’re selected to provide insights into the performance of specific tactics or processes. Examples of tertiary KPIs include:
- Click-through rates
- Email open rates
- Landing page bounce rates
- Social media shares
Even though they’re third on the list, tertiary KPIs are no less relevant.
Very often, the seemingly smaller tertiary metrics are where experienced strategists can see the beginnings of trends (aka: leading indicators) and proactively fine-tune their strategies for better results.
The relationship between KPIs and marketing ROI
Category leaders in every vertical succeed because they have exponentially more traffic coming in from direct/organic sources – approximately 60% of their traffic.
How on earth do they accomplish that?
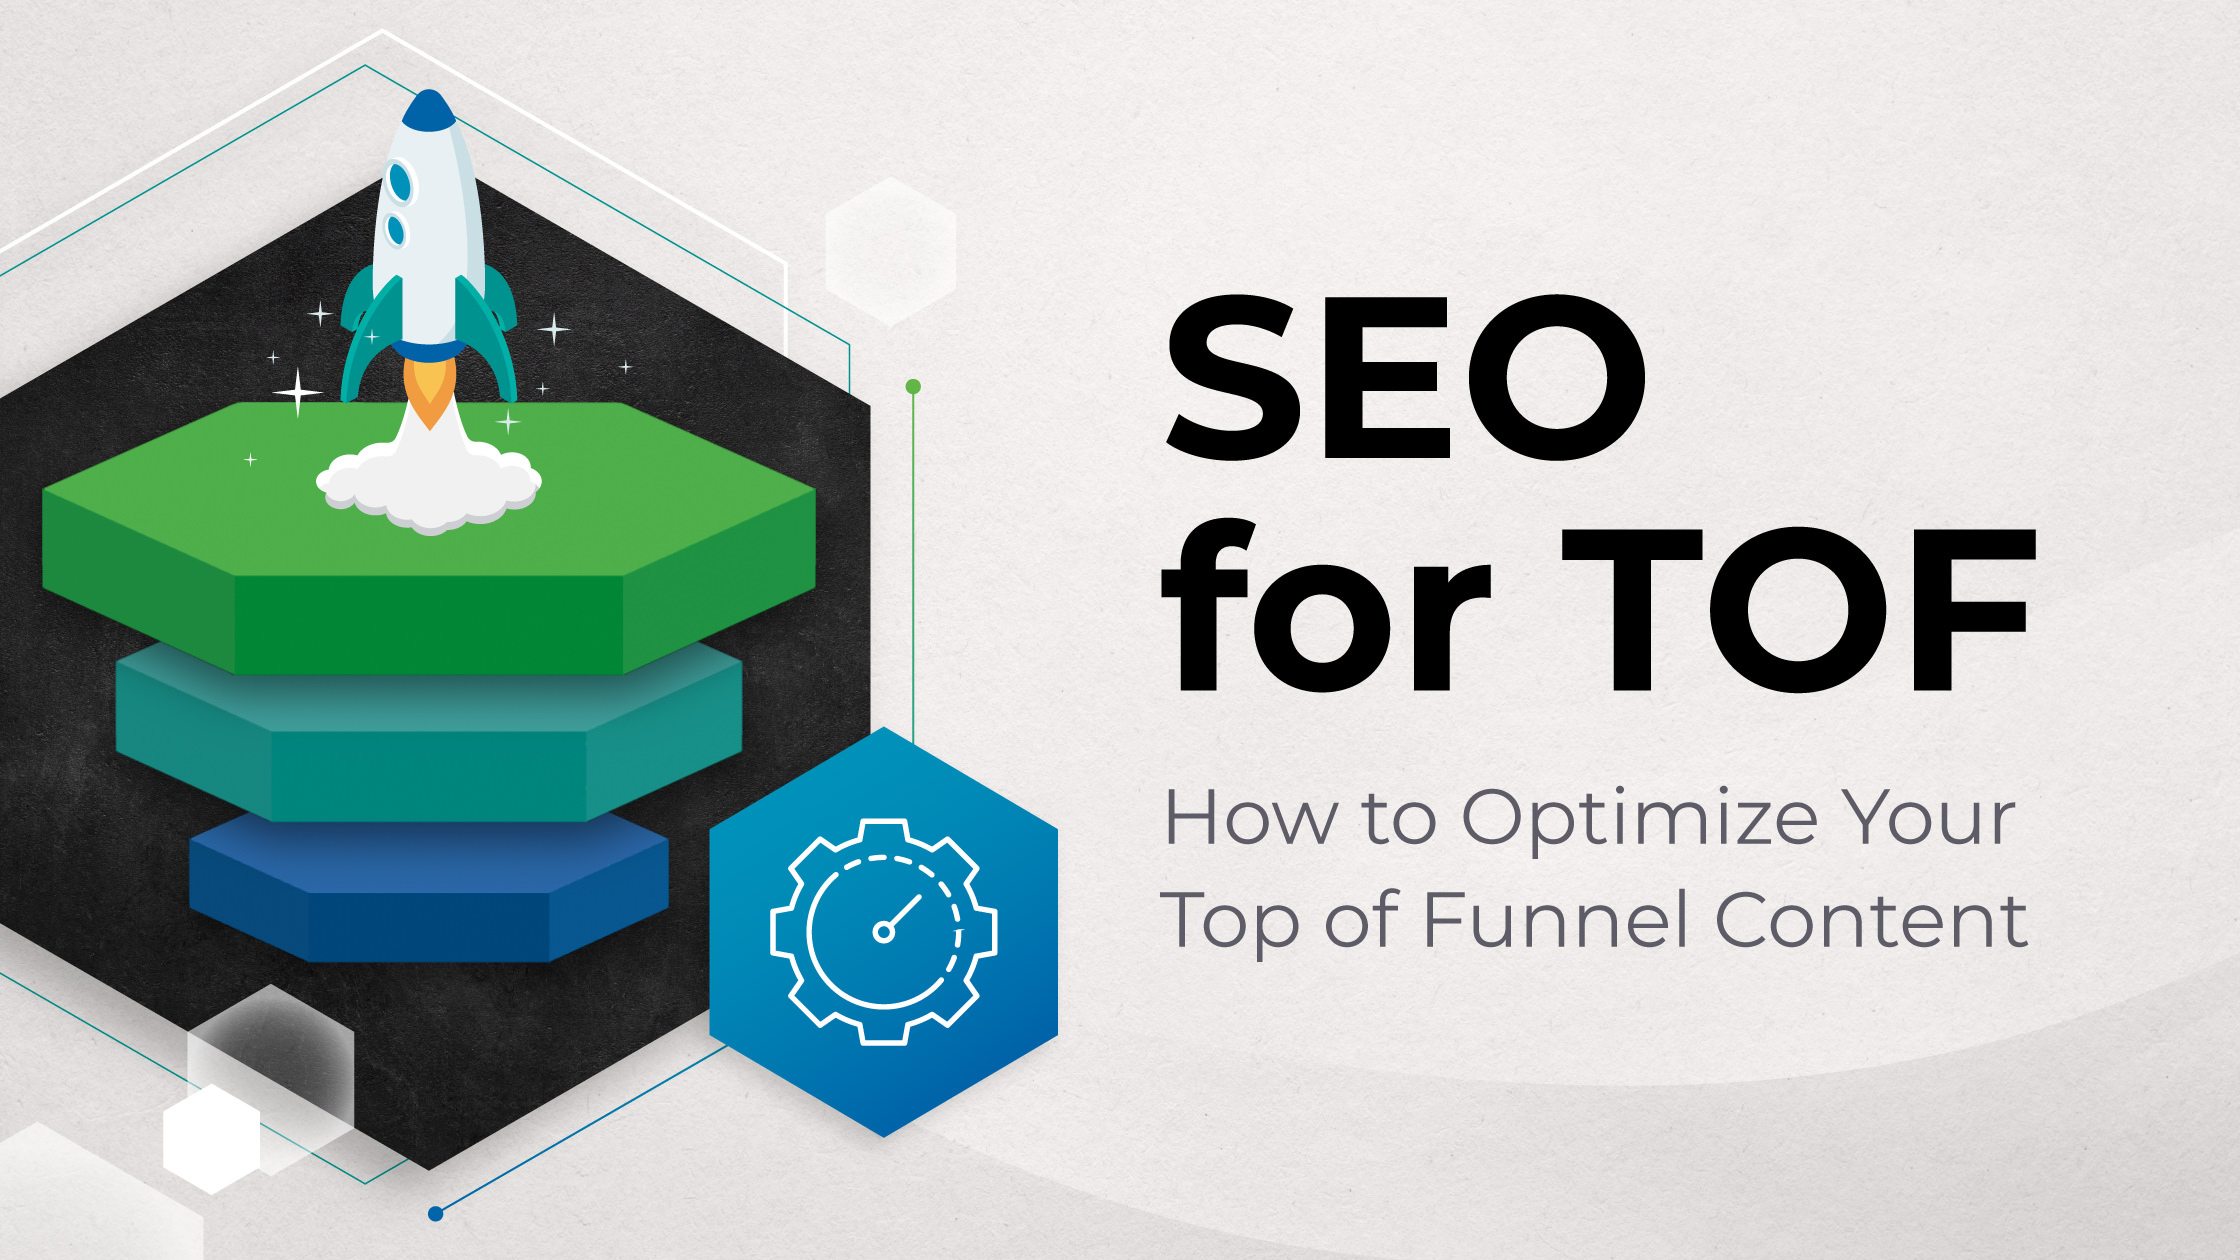
By spending roughly 50% of their total marketing budget on the top of the funnel.
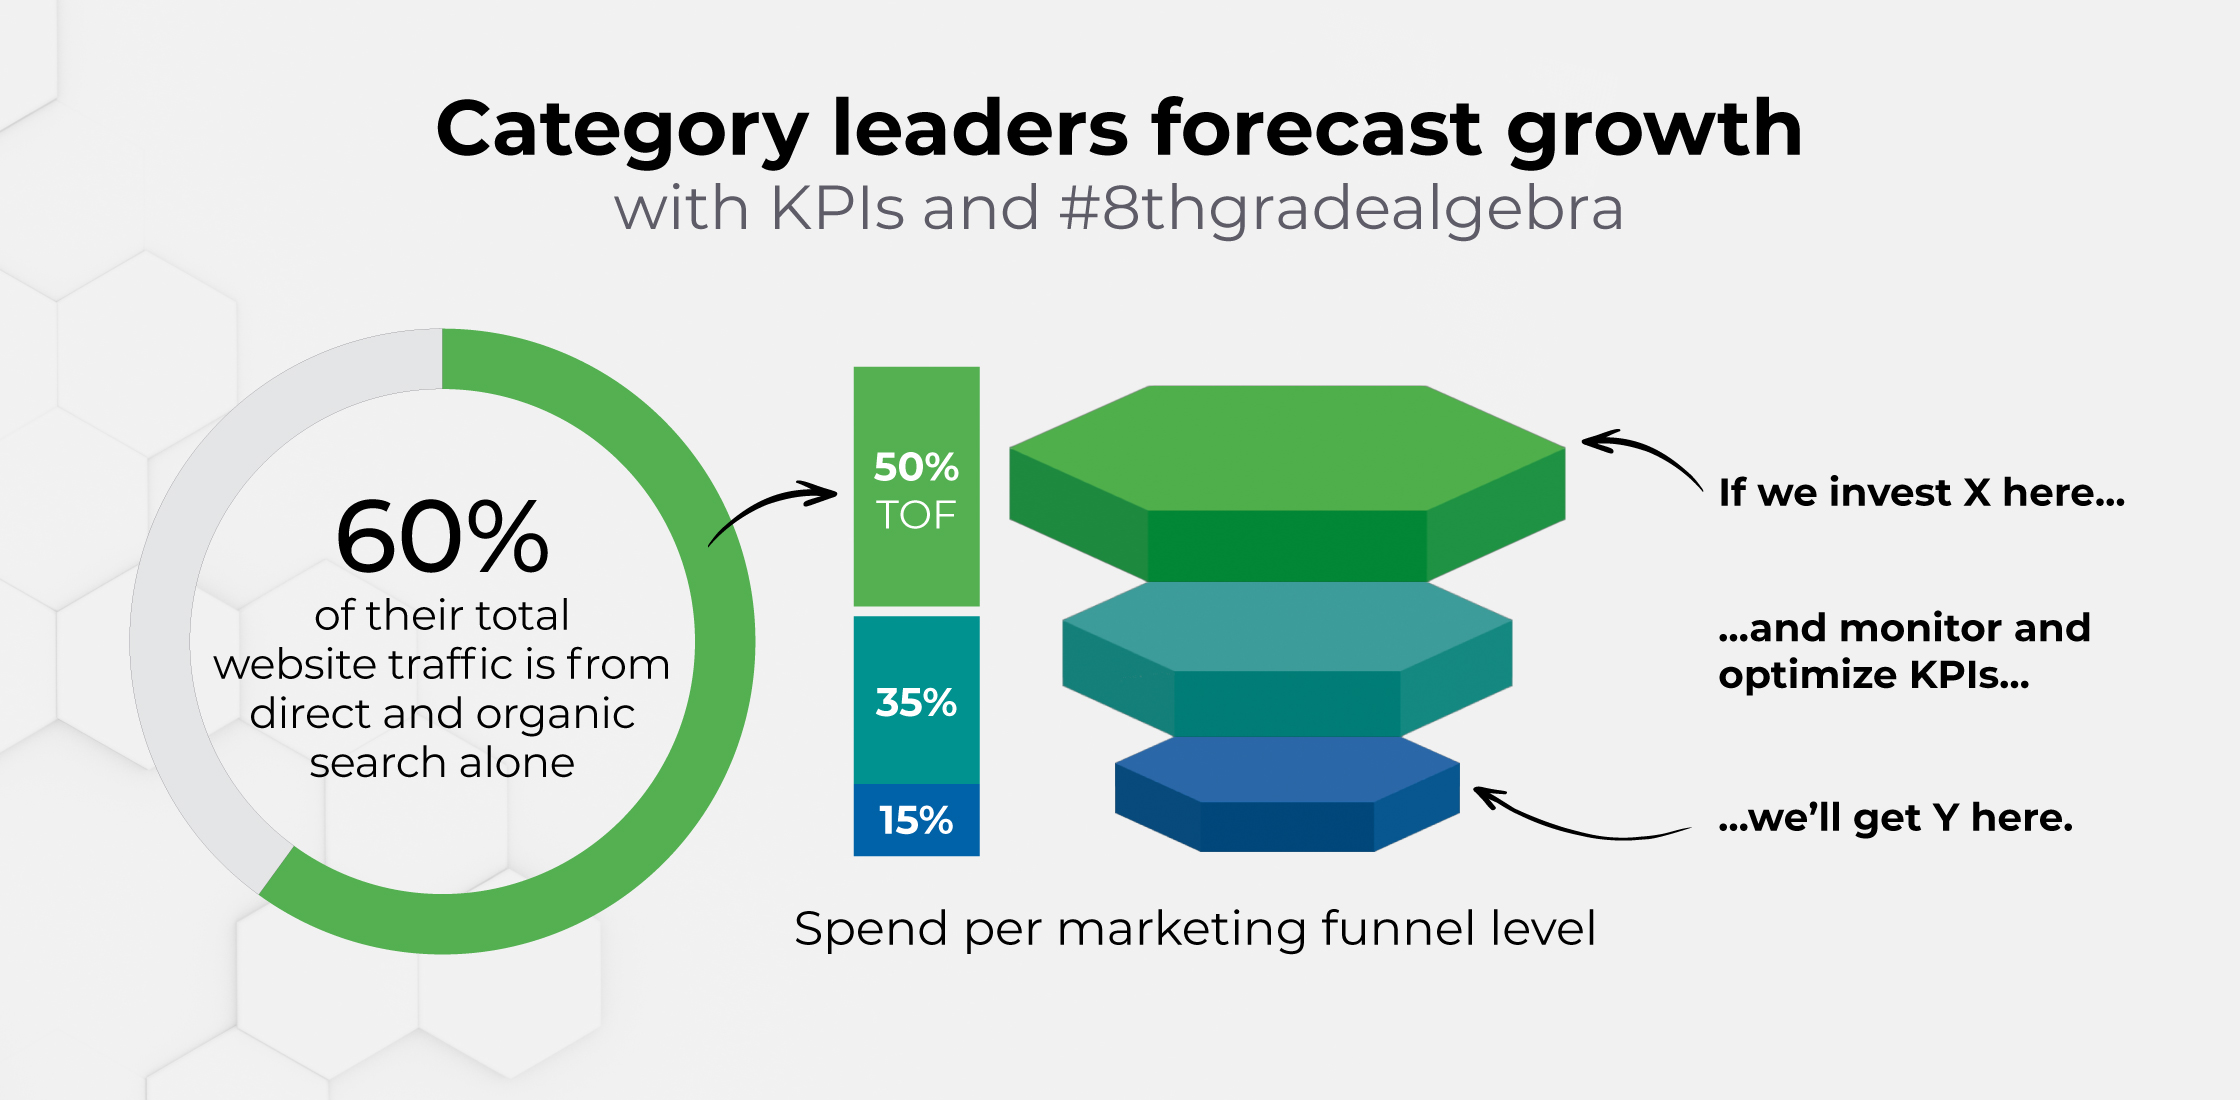
#8thgradealgebra shows us that lower funnel conversion is mathematically correlated to the amount of activity generated at the upper funnel, which is why category leaders devote half of their ENTIRE budget to the upper funnel.

Plug your last campaign’s numbers into our Marketing ROI Calculator and see for yourself. Marketing performance isn’t rocket science – it’s basic math.
Increasing organic/direct traffic reduces your dependency on Paid Media. Lower expenses. Higher ROI.
Because we can calculate revenue figures based on the number of upper funnel impressions, measuring up funnel KPIs functions as a critical success indicator.
Those KPIs can reliably forecast that X will happen two weeks from now, or Y will materialize six months from now. Similarly, religiously tracking KPIs throughout all stages of the funnel quickly identifies any breaks so they can be remedied immediately.
Are you looking to validate sales team performance and drive more organic/direct (aka: cheaper) traffic?
Then you need KPIs mapped to each stage of the funnel, and experts meticulously monitoring those metrics and optimizing in real time.
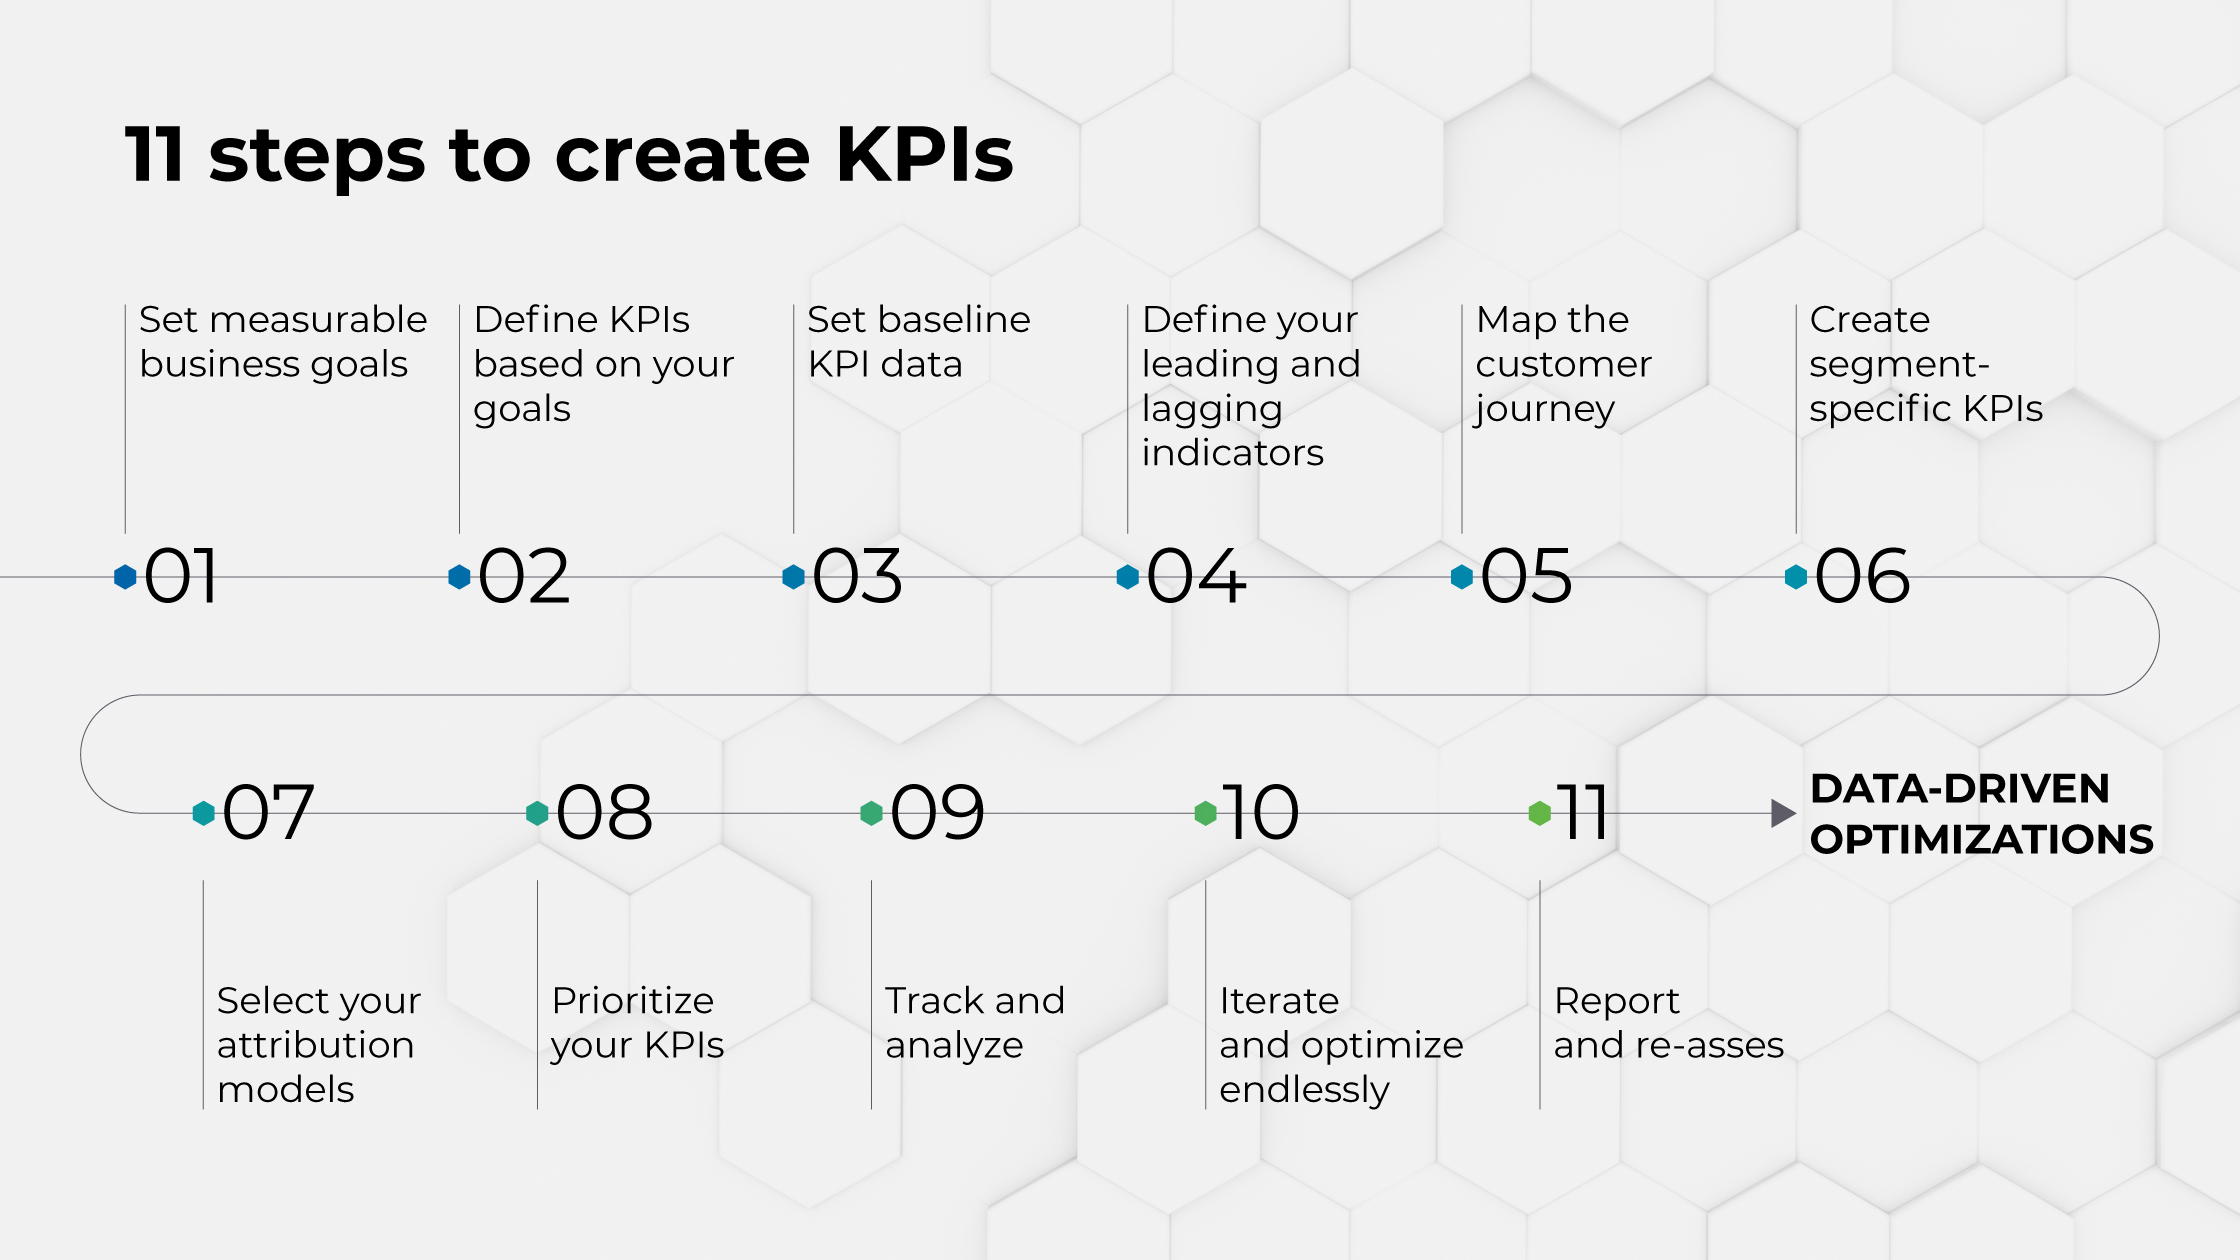
How to create KPIs: Our 11-step guide
Step One: Set measurable business goals
Be precise about exactly what your priority is, with a numerical and time-bound goal. Some common performance objectives are:
- 2X website traffic within the next quarter
- 7% increase in AOV during Holiday Campaign
- 20% revenue increase from organic/direct traffic by end of year.
Step Two: Define KPIs based on your goals
There is such a thing as a bad or good KPI, so be discerning here. Narrow in on the metrics that best indicate progress toward your goals.
For instance, if doubling organic/direct traffic is a goal, metrics like unique visitors, pageviews, and bounce rate are likely relevant. But your email open rate or conversion rate would not be a relevant KPI for that goal.
Step Three: Set baseline KPI data
This is maybe the most overlooked step on this list.
Measuring performance data at a single moment in time, with no historical context for that metric, doesn’t reveal as much as you think it does.
Before you change a thing, record the baseline data of your chosen metrics. This gives you a point of comparison to measure progress against.
Step Four: Define your leading and lagging indicators
Think of KPIs as the north stars guiding your way. Think of leading and lagging indicators as weather patterns offering a prediction of how things are changing in the skies.
In addition to defining KPIs, every brand needs to define its leading and lagging indicators.
These indicators are predictive metrics that highlight your progress toward a goal; indicating whether you’re pacing well to achieve your KPIs within a given timeframe or not.
Step Five: Map the customer journey
Each stage of the customer journey needs its own KPIs. For example, click-through rate might be the ideal KPI for the awareness stage, whereas form submission might be your primary KPI for the consideration stage.
KPIs make no sense without a deep understanding of your customer’s journey to purchasing your product.
We’ll say more below about why the customer’s journey through your marketing funnel MUST be a constant consideration when defining KPIs.
Step Six: Create segment-specific KPIs
Most brands have multiple user personas and/or audience stakeholders. As a result, it’s advantageous to produce a distinct marketing experience for each segment, which therefore requires implementing KPIs tailored to each segment.
Step Seven: Select your attribution models
An attribution model is a framework used in marketing and analytics to determine the value of individual touchpoints in a customer’s journey.
Instead of blanket statements that apply to all customers, attribution models help marketers understand how individual channels, campaigns, and interactions motivate (or don’t) a prospect/lead toward making a buying decision.
Some of the most common types of attribution models include:
- First-touch attribution
- Last-touch attribution
- Linear attribution
- Time decay attribution
- Position-based (or U-Shaped) attribution
- Algorithmic attribution (Note: This one is common but the least reliable. Proceed with caution.)
Step Eight: Prioritize your KPIs
All KPIs are not created equal. Rank them in order of significance.
The hierarchy of your priorities should inform all strategic decisions and resource deployment.
Step Nine: Track and analyze
Create a KPI dashboard to monitor and analyze the vast amounts of performance data you’ll get in a single view.
Note: Every marketing dashboard should be highly customized for that brand’s specific needs. There is no universal dashboard template that applies to every organization.
Reliable dashboards are essential for identifying user behavior trends, performance patterns, and optimization opportunities.
Step Ten: Iterate and optimize endlessly
Children’s author E.B. White once said, “The best writing is rewriting.” We couldn’t agree more.
Successful performance management isn’t a quest to “get it right” the first time around, although we always aim for quick wins right off the bat.
What matters most – and is the most sustainable way to run a business – is the willingness to keep sifting through mountains of data to find actionable insights and adjust your strategies and tactics accordingly. Then look at the revised mountain of data and keep repeating the process.
Long-term performance requires continuous analysis and improvements.
Step Eleven: Report and re-asses
To be most effective, we believe reporting needs to be segmented for the relevant stakeholders.
This is another reason why we adore the marketing analytics experts on our team – a layered approach to reporting would be a nightmare without the thorough and up-to-date dashboards they create for our client-partners.
- Executive level view: This pared down reporting view is likely only needed once a quarter. It answers the simple question, “Is our marketing working or not?”
- Week-to-week primary contact view: This page/pages goes a level deeper and provides insights into leading and lagging indicators. Analyzing these metrics supports planning and resource reallocation decisions.
- Channel experts view: The most granular portion of the dashboard, this view is largely what channel experts will use to identify trends so they can tweak something today that will protect the brand two months down the road.
Every reporting process should include a review and potential refinement of your KPIs.
As business goals shift or market conditions fluctuate, brands need to be nimble and willing to adjust KPIs as needed.
EXTRA TIP: Don’t panic if you see a dashboard with a lot of pages (10 or more). If it’s been implemented by a trustworthy analytics expert, those pages aren’t data-overkill – they’re different data views that support the work of the different members of the team.
How to measure KPIs
Above, we extolled the virtues of a customized marketing dashboard with clean and reliable data. That’s one half of the coin when it comes to accurate KPI measurement.
The other necessity is a seasoned marketing expert who’s experienced in interpreting that data within the context of your industry and brand specifics.
Data alone gets you nowhere. The gold is in finding skilled experts to convert raw data into actionable insights.
If your entire martech stack isn’t connected to your dashboard (we STRONGLY recommend doing so), KPI measurement has to start with pulling together all relevant data. Once that’s done, the experts you’re partnering with will guide you through the following steps:
- Define the measurement interval based on your goals and marketing pace.
- Align on a “source of truth” for each data set and the aggregate. Many platforms measure the same KPIs, but usually with varying results.
- Calculate KPI values for the period you’re measuring.
- Compare KPI values to your predetermined goals or benchmarks.
- Visualize data (there we go again, rooting for marketing dashboards…) to speed up data comprehension and identify connections between specific marketing activities.
- All of the above coalesces to produce insights that will highlight which KPIs are worthy of a celebration and which require optimization attention.
KPI measurement is a weekly activity, at minimum.
Someone should be responsible for providing ongoing attention and analysis, so that your marketing strategy and tactics can adjust swiftly when the data warrants it.
For example, when running SEM or other paid media campaigns, our Apiary consultant-partners optimize buys DAILY. Conventional agencies glance at those things every 2-3 weeks.
Performance measurement should be as regular as Tuesday.
5 reasons to map KPIs to your marketing funnel
One of the primary benefits of KPIs is that they help us observe and qualify what moves a potential customer from Awareness to Consideration to Decision (upper funnel to mid funnel to lower funnel).
And isn’t that the crux of everything we need to know as marketers?
When KPIs are clearly associated with the core phases of the funnel, performance improvements become far more targeted and efficient.
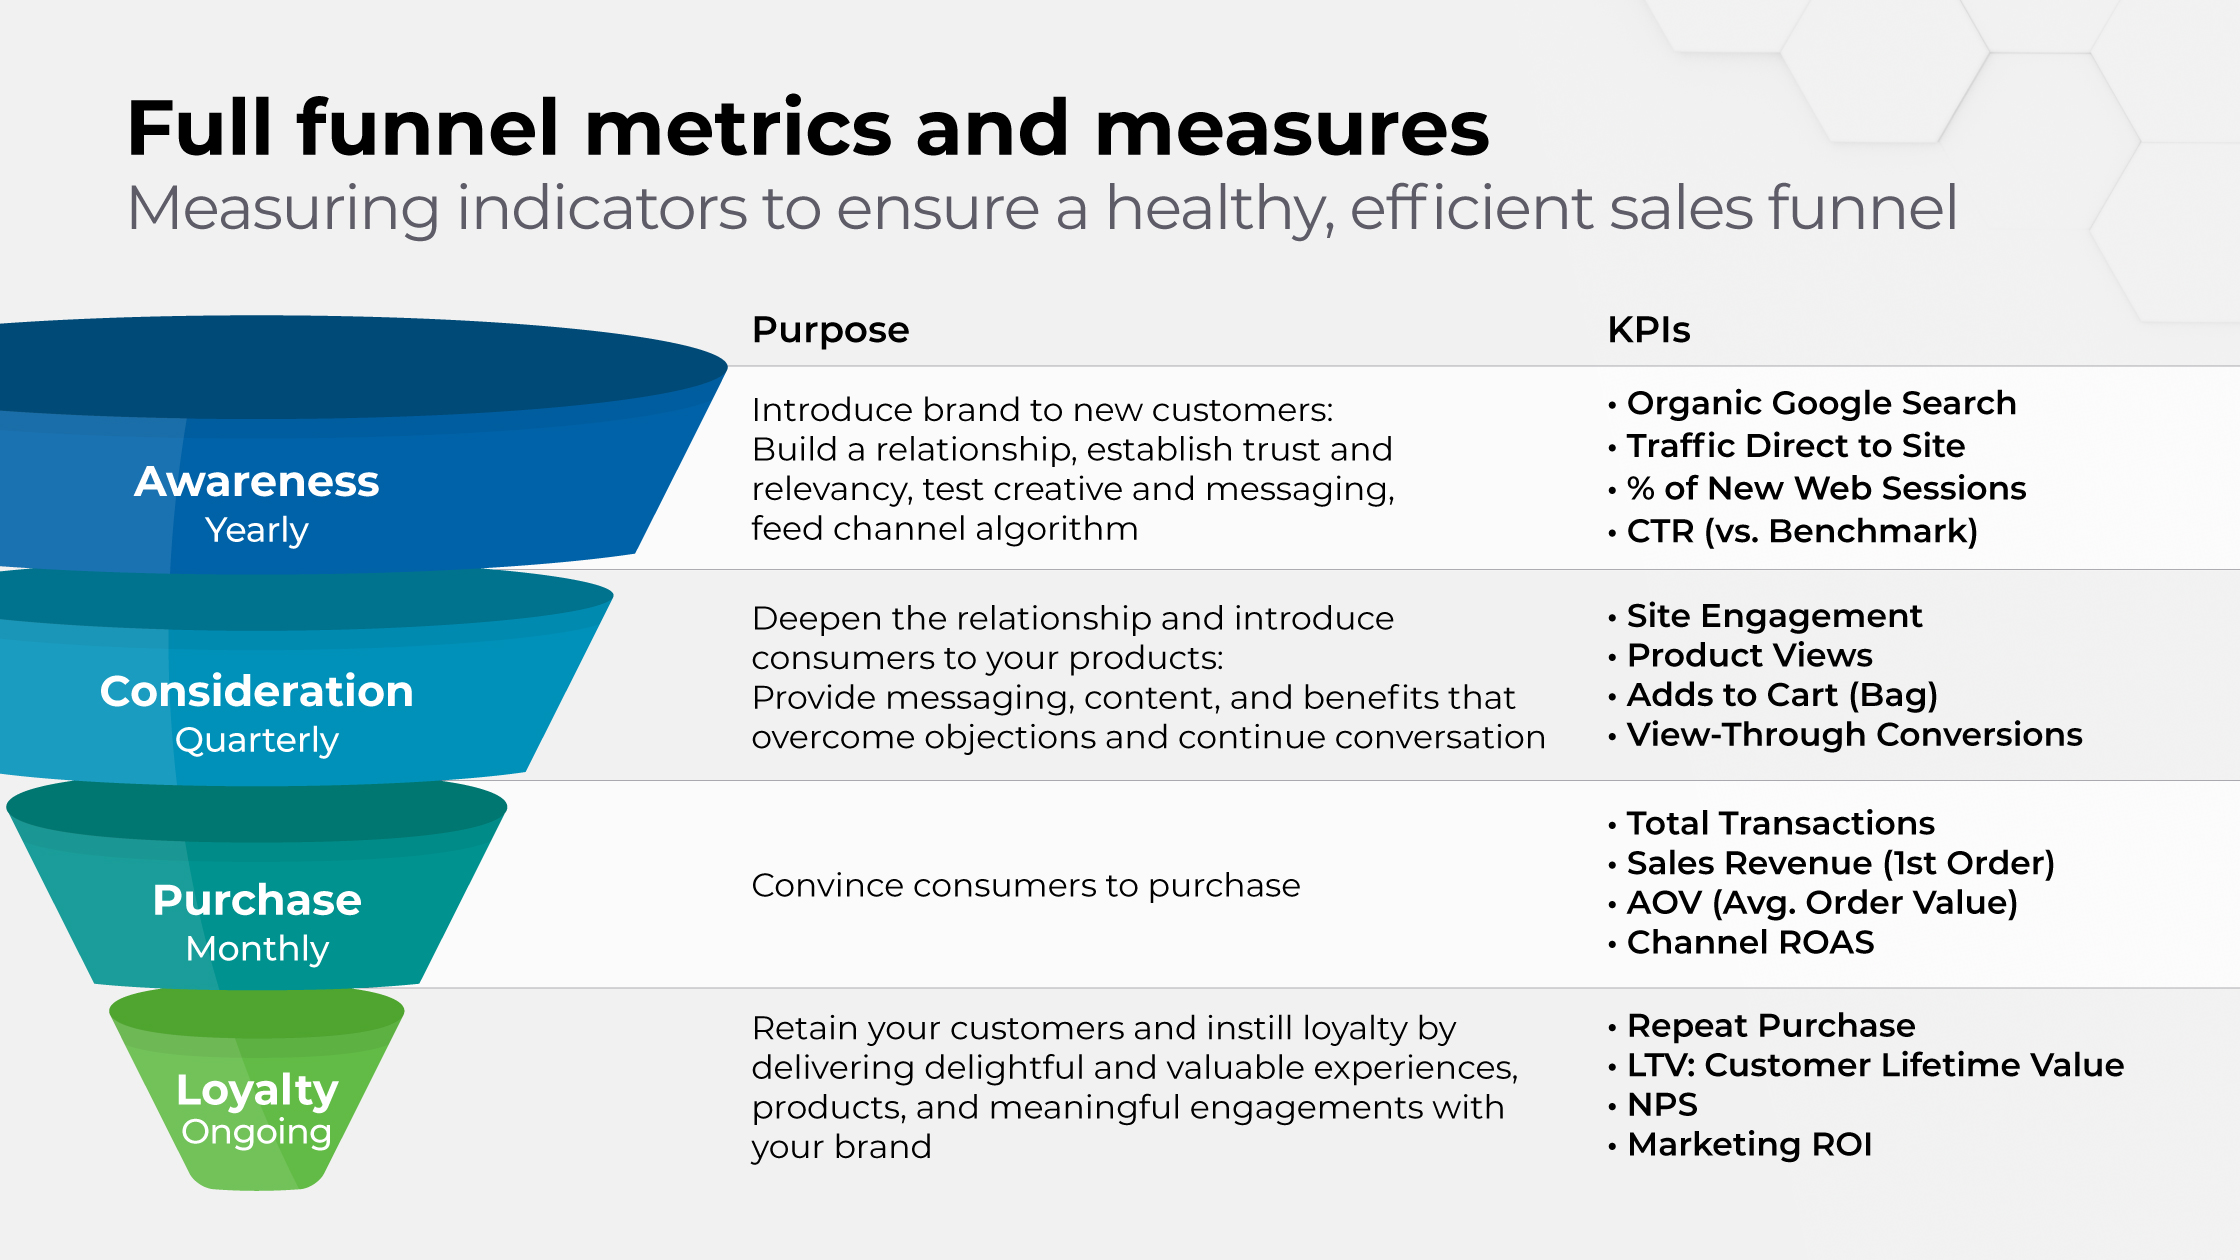
By understanding how marketing efforts are affecting customers at each stage of the funnel, a brand is better equipped to make strategic and data-driven business decisions that grow the bottom line.
- Determine the root cause of performance bottlenecks with data instead of guesswork.
- Direct your budget to the stages of the funnel that need attention first.
- Use data to confirm which activities are more effective during each funnel stage.
- Use data to validate content and messaging that aligns to each funnel stage.
- Initiate targeted performance solutions in the exact location where they’re needed instead of broadly disbursing resources across the entire funnel (woefully ineffective).
KPI insights allow us to drill down even further to know precisely how many impressions a brand needs to acquire, over what time period, and at what cost.

Brand awareness ROI absolutely can be measured.
Learn how we measure and track Brand Awareness ROI.
KPI example from a client-partner
An eCommerce client-partner experienced an increase in site traffic, but a decrease in revenue. They were tracking site traffic as a leading indicator to sales.
Upon investigation, we discovered that their conversion rate dropped because of an influx of paid media and new site pages that weren’t optimized for organic and direct traffic, which converts at a higher percentage. Aligning to the right KPIs provided a clear answer and troubleshooting solution.
And before we go… Here’s something else we’ve seen frequently:
KPI measurement is a great way to catch dissonance in the customer journey.
Conversion moments on your landing pages are typically focused on one thing (maybe form submission for a B2B brand or conversion for eCommerce), but that’s not the overarching goal of the top and middle of the funnel, which is where the dissonance comes in.
Unoptimized site pages in the lower funnel create a disjointed customer experience that often clashes with the top and mid funnel portion of the journey.
This can also happen in reverse…
Some brands are brilliantly generating awareness at the top of the funnel but then swiftly abandon the “thing” (it could be anything from your core messaging pillars to content cadence to personalization, really anything) that was activated at the top of the funnel.
As customers move down the funnel, it’s as if they’re now interacting with a wholly different brand. And this disconnect causes increased lead dropoff, fewer conversions, and less long-term loyalty.
All of which circles us right back to KPIs.
- Measure the right things.
- Measure A LOT of things, not just sales.
- Measure those things every single week — daily, in some conditions.
- Measurement serves no purpose if it’s not closely aligned to the customer’s journey through the funnel.
TL;DR on KPI development
- Key Performance Indicators (KPIs) are a way of measuring the success of your marketing efforts.
- High performing marketing teams measure KPIs and leading and lagging indicators at least once a week.
- KPIs should be mapped to each stage of the sales cycle and function across three tiers: primary, secondary, and tertiary.
- Meticulous KPI tracking is how brands can forecast performance and quickly identify any breaks in the funnel that require immediate resolution.
- If you’re curious about how to set KPIs, partner with an experienced growth marketing strategist and move through the 11 steps in our KPI Creation Guide above.