You’ve heard about marketing dashboards. Maybe you have one of your own.
But…
Begging you to read our blog posts isn’t our style, but please read this one.
Marketing dashboards is a topic that’s full of misconceptions, missed opportunities, and blindspots galore. Today’s Apiary POV is aiming to change that, by clarifying:
- What is a marketing dashboard?
- Why Apiary believes dashboards are non-negotiable
- 6 BIG marketing dashboard mistakes to avoid
- How to create a marketing dashboard
- 3 marketing dashboard examples from our client-partners
- Our go-to marketing dashboard tools
What is a marketing dashboard?
A marketing dashboard is a visual display of key performance indicators (KPIs) and marketing metrics. When created and managed well, digital marketing dashboards are a crucial tool for marketing teams who need to track performance and quickly respond to optimization opportunities.
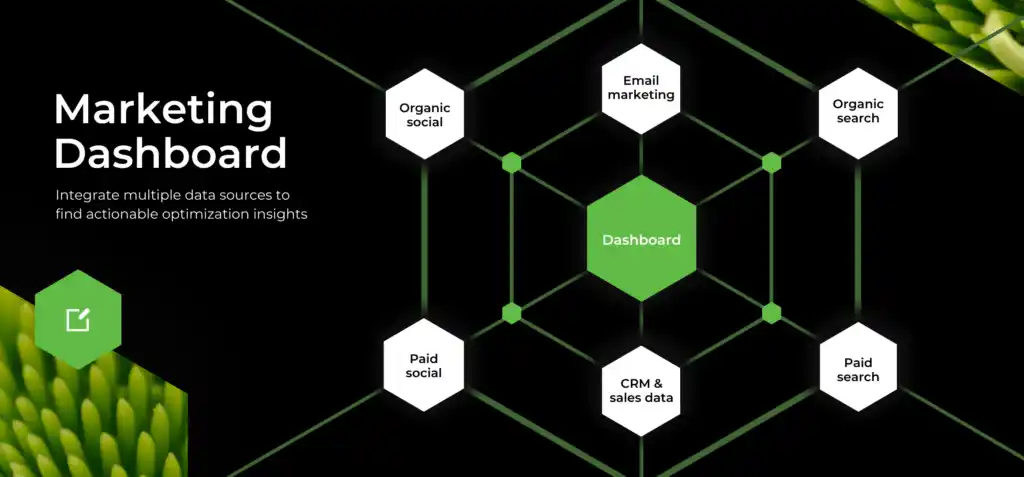
A marketing dashboard is the central hub of all your marketing data.
Think of your dashboard as the hub of a wheel, and each piece of marketing activity is a spoke on that wheel. Email marketing, organic social, paid social, organic search, paid search, your CRM system and all associated sales data.
PRO TIP: Heard that some marketing channels can’t be connected to a dashboard? You were misinformed. If it’s on the internet, it can and should be in your marketing dashboard.
But more than just gathering all this data in one place, the best dashboards smartly visualize data with charts, graphs, and streamlined tables, so that teams can convert data into actionable insights.
Instead of staring at dense spreadsheets all day, dashboards provide quick and clear views of what’s happening, what can be reasonably projected, and where optimization opportunities exist.
Why Apiary believes dashboards are non-negotiable
Your marketing ecosystem is a series of overlapping threads, impacting each other in a variety of ways that aren’t always apparent by looking at the surface of things.
Performance decisions that ignore the data inside all those overlapping threads of activity are inherently flawed. At best, this is a guaranteed way to leave money on the table. At worst, we’ve repeatedly seen this M.O. lead to businesses going under.
A marketing dashboard leverages the most powerful data visualization and real-time data integration technology to provide a concise overview of the full orchestra that is your marketing performance – not just the first flute and the tambourine.
And with increasingly remote teams and/or brands operating with a mix of in-house and external consultants and agencies, a marketing dashboard supports goal cohesion and collaboration. One source of truth keeps everyone aligned and on track.
6 marketing dashboard mistakes to avoid
1. You don’t have a marketing dashboard.
See above.
2. Pretty but not functional.
Those of us who love crossing things off the to-do list might be tempted to knock out a beautiful dashboard and feel quite pleased with ourselves. Resist this urge!
Don’t build a dashboard just to have a prettier version of your data. Build it as a function of the KPIs that your business depends on. Purpose over pretty.
3. Generic. No customizations.
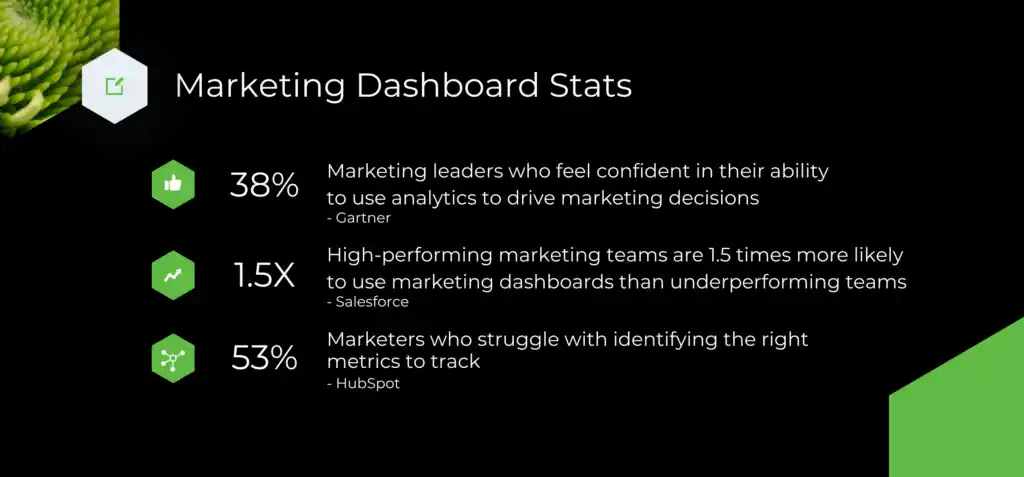
Sure, every business cares about some of the same things. Revenue, Customer Acquisition Cost (CAC), Average Order Value (AOV), etc.
But each business approaches the process of growing/reducing these metrics differently, which is why a supposedly “universal” marketing dashboard doesn’t exist.
For example, an entrenched B2B business prioritizing upsells needs a different dashboard view than a D2C brand moving into a new product category. Always customize.
4. No one’s looking at the dashboard.
A recipe for disaster.
5. Someone told you data fidelity is a one-and-done.
Most marketing dashboards integrate anywhere from three to a dozen or more data sources.
However, each platform sends updated data in their own cadence, so it’s important to check the timing of the last update before drawing any major conclusions from what you’re seeing.
Additionally, connections across any of these platforms can and do “break”, but these disconnections often aren’t immediately apparent, which means you could be making performance decisions based on flawed data.
To trust the reliability of your data, you need technical expertise monitoring the dashboard. Data fidelity is never “set it and forget it”.
6. Reporting structure isn’t optimized for your team.
Just as marketing dashboards need to be customized for each brand, your data analysis and reporting process should be customized for your team.
- Who will be reviewing every bit of the nitty gritty?
- For the nitty gritty people, what is their learning/retention style? They may require different views of the same data.
- Who will be reviewing the overview only?
- Who determines what qualifies for inclusion in the overview?
- Is dashboard monitoring daily, weekly, bi-monthly, monthly?
- How will data security and privacy be addressed, ensuring compliance with GDPR or CCPA?
What should a marketing dashboard include?
While we caution against overreliance on generic marketing dashboard templates, here are some of the most common elements you’ll see on a marketing dashboard:
1. Overall marketing performance
An overview of metrics like revenue, total leads, sales, and cost per acquisition (CPA).
2. Website metrics
Your web analytics dashboard monitors website traffic, bounce rate, time on site, and page views. These details often help identify website issues and areas for improvement.
3. Social media metrics
A social media dashboard provides insights for optimizing your content marketing strategy by understanding how each piece of content impacts followers, engagement rate, and impressions.
4. Email marketing metrics
One central view of open rates, click-through rates, and conversion rates to understand the efficacy of your email marketing campaign performance.
5. Advertising metrics
The marketing performance dashboard for your advertising campaigns analyzes ad spend, impressions, clicks, and conversion rates, showing what’s working and what needs improvement.
6. Sales metrics
The relationship between marketing and sales needs constant attention. Look at the number of sales, revenue generated, and average order value to see opportunities to optimize the funnel.
7. Campaign-specific metrics
When you’re running targeted marketing campaigns, it’s necessary to keep eyes on what is driving clicks and conversions so that you can improve performance on the fly or integrate learnings for the next campaign.
How to create a marketing dashboard
The specific context of your business will shape the optimal process for creating your marketing dashboard. (We can’t shout “customize!” enough.) That said, a typical process often includes the following steps:
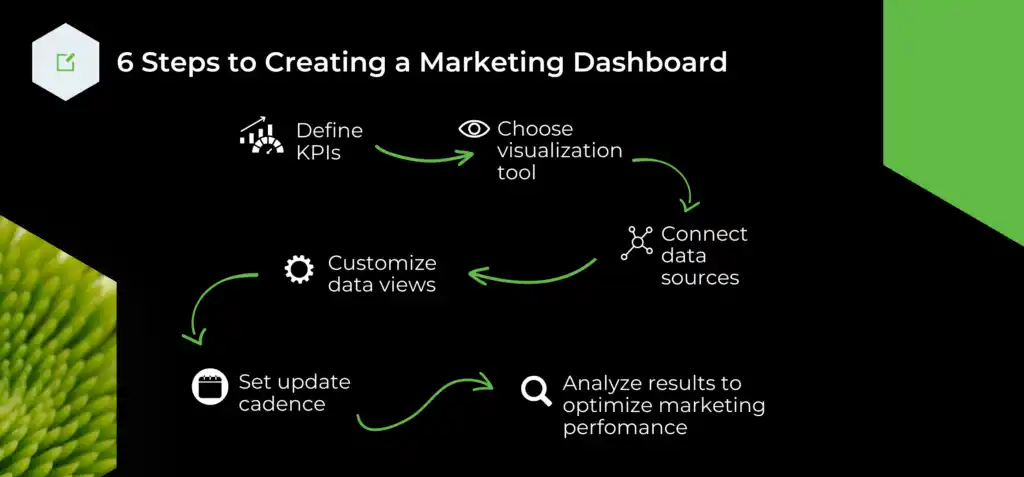
- Define your KPIs. This could include website traffic, lead generation, conversion rates, social media engagement, and more.
- Choose a data visualization tool. Google Data Studio, Microsoft Power BI, and Tableau, are some of the most popular. The best tool is the one that integrates well with your data sources and is easy enough for your team to use consistently.
- Connect data sources. Integrate it all. Google Analytics, social media platforms, email marketing tools, your CRM, and more. Confirm the data is accurate and current.
- Organize and customize. Choose your layout, including the charts and graphs displaying your KPIs. Add any custom views your brand needs. Labels, colors, and other design elements can make the dashboard easier to read and understand.
- Set up automatic updates
Schedule regular updates, ensuring the dashboard always provides the latest data.
- Analyze your data
Use your dashboard to track KPIs and identify trends or areas for improvement. Turning data into actionable insights lets you adjust your marketing strategy as needed and optimize campaigns for the best results.
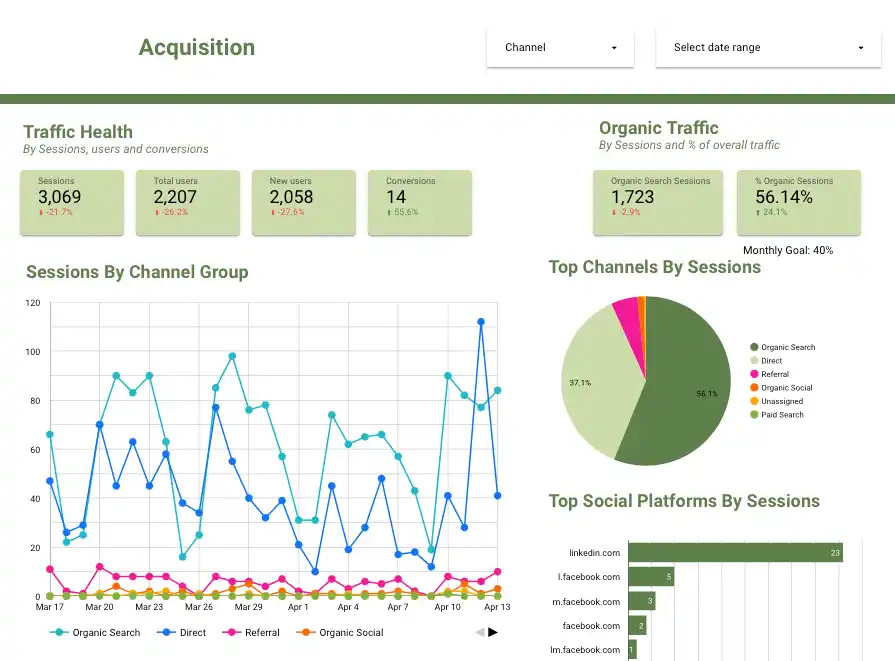
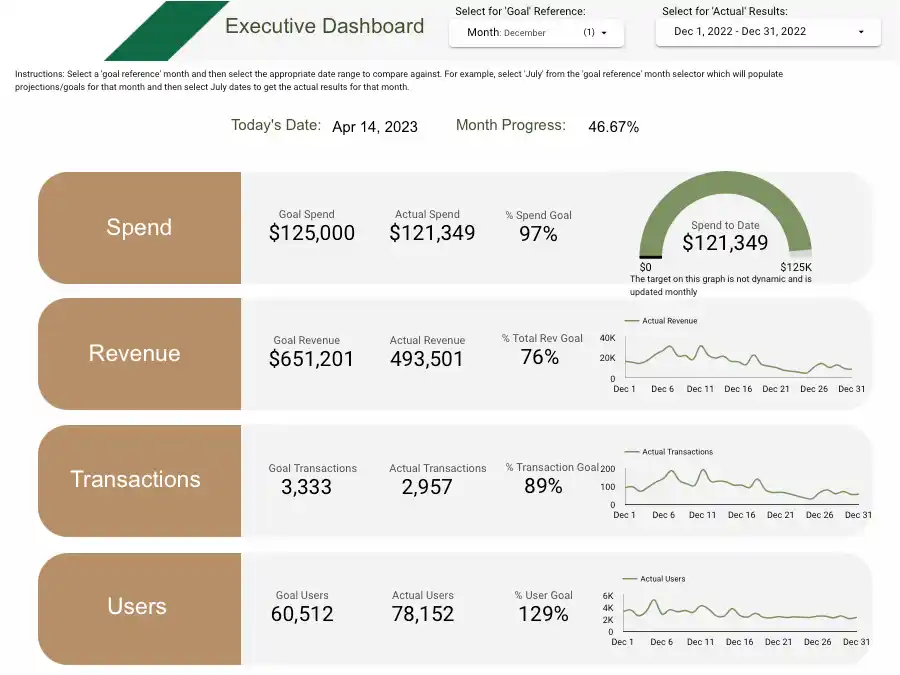
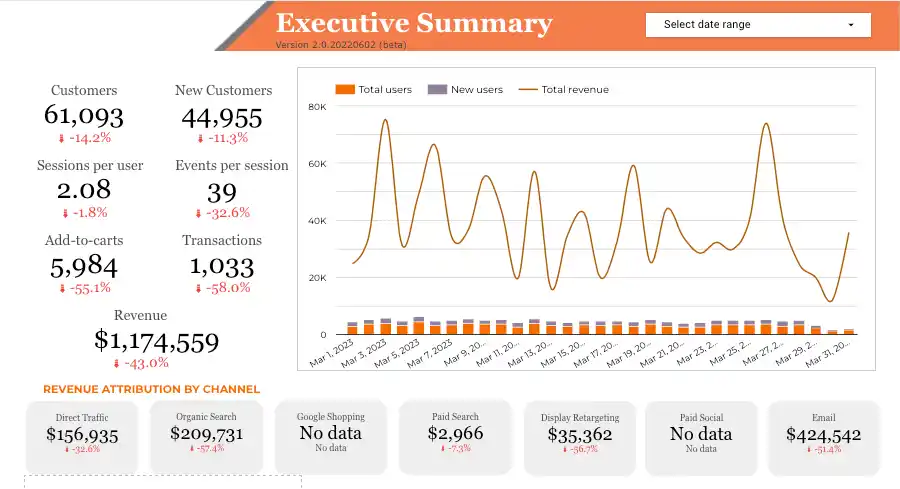
3 marketing dashboard examples from our client-partners
Scenario 1: Dashboard revealed a huge misassumption in their paid media budget.
When we first met this client-partner, they had no marketing dashboard at all. We created one and they were shocked to discover that the bulk of their conversions were actually coming from organic traffic, not paid traffic.
Before these insights from their new marketing dashboard, they’d planned to double down on paid media. However, the data showed that shifting resources toward organic SEO performance improvements would drive more ROI.
Scenario 2: Dashboard showed that UX was a bigger problem than traffic.
When we met this eCommerce client, they already had a marketing dashboard but didn’t find it particularly useful. We added a connection to their projected results and established benchmarks to provide insight into the causes of any shortfall.
The expanded connections and views we provided made it apparent their ad spend was absolutely generating enough users to hit targets, but they were underpacing on conversions and revenue, pointing to a UX optimization opportunity.
Scenario 3: Unknowingly making decisions based on inaccurate dashboard data
When we met this client-partner, they were already convinced that marketing dashboards are crucial. They made every performance decision based on insights from their dashboard.
The problem? Early in our engagement, we discovered broken connections to critical sales channels that prevented holistic analysis of the eCommerce ecosystem. Repairing these links and adding optimized views resulted in smarter decisions on budgets and outcomes.
The most common marketing dashboard tools
Google Analytics is usually the first analytics tool we recommend because it allows you to track website traffic, user behavior, and conversion rates. Knowing what’s happening on/in relation to your branded domain is always the starting point of every dashboard.
From there, the tools we most commonly use are:
EXTRA TIP: Make sure anyone advising you on dashboard creation/customization is a Google Analytics Certified Partner.
1. Data Studio
This free data visualization tool from Google creates custom dashboards and reports, pulling from data sources like Google Analytics, Google Ads, and other third-party platforms.
2. Salesforce
One of the premier CRM options for managing the relationship between sales, marketing, and customer service.
3. Hubspot
An all-in-one inbound marketing and sales software that provides tools for blogging, social media, email marketing, lead management, and more.
4. Tableau
This data visualization and business intelligence tool offers advanced analytics and interactivity.
5. Klipfolio
Klipfolio offers a range of pre-built data connectors and visualizations, plus the ability to create custom metrics and KPIs.
6. Databox
Very similar to Klipfolio, many users find Databox’s interface to be simpler and more intuitive.
TL;DR marketing dashboards
- Marketing dashboards are not a “too advanced” tool that only some brands are ready for – they are table stakes for any brand seeking growth.
- The most common marketing dashboard mistakes we see are: 1) Not having one. 2) Not looking at it. 3) No technical experts checking data fidelity.
- Marketing dashboards share many common elements, but always need to be customized for your brand’s specific goals.